


Congressional District 3, Oklahoma
About
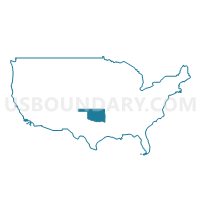
Outline

Summary
| Unique Area Identifier | 118839 |
| Name | Congressional District 3 |
| State | Oklahoma |
| Area (square miles) | 34,383.43 |
| Land Area (square miles) | 34,069.42 |
| Water Area (square miles) | 314.00 |
| % of Land Area | 99.09 |
| % of Water Area | 0.91 |
| Latitude of the Internal Point | 36.10580870 |
| Longtitude of the Internal Point | -98.84022450 |
| Total Population | 732,394 |
| Total Housing Units | 324,436 |
| Total Households | 280,317 |
| Median Age | 36.9 |
Maps

Graphs
Select a template below for downloading or customizing gragh for Congressional District 3, Oklahoma


Neighbors
Neighoring 111th Congressional District (by Name) Neighboring 111th Congressional District on the Map
- Congressional District 1, KS
- Congressional District 1, OK
- Congressional District 13, TX
- Congressional District 2, OK
- Congressional District 3, NM
- Congressional District 4, KS
- Congressional District 4, OK
- Congressional District 4, CO
- Congressional District 5, OK
Top 10 Neighboring County (by Population) Neighboring County on the Map
- Oklahoma County, OK (718,633)
- Tulsa County, OK (603,403)
- Comanche County, OK (124,098)
- Canadian County, OK (115,541)
- Payne County, OK (77,350)
- Creek County, OK (69,967)
- Pottawatomie County, OK (69,442)
- Garfield County, OK (60,580)
- Grady County, OK (52,431)
- Washington County, OK (50,976)
Top 10 Neighboring County Subdivision (by Population) Neighboring County Subdivision on the Map
- Tulsa CCD, Tulsa County, OK (569,469)
- Oklahoma City Southwest CCD, Oklahoma County, OK (429,392)
- Oklahoma City Southeast CCD, Oklahoma County, OK (145,193)
- Oklahoma City Northwest CCD, Oklahoma County, OK (127,076)
- East Canadian CCD, Canadian County, OK (86,541)
- Shawnee CCD, Pottawatomie County, OK (64,590)
- Stillwater CCD, Payne County, OK (63,113)
- Enid CCD, Garfield County, OK (53,331)
- Bartlesville CCD, Washington County, OK (43,070)
- Sapulpa CCD, Creek County, OK (37,551)
Top 10 Neighboring Place (by Population) Neighboring Place on the Map
- Oklahoma City city, OK (579,999)
- Tulsa city, OK (391,906)
- Edmond city, OK (81,405)
- Enid city, OK (49,379)
- Stillwater city, OK (45,688)
- Bartlesville city, OK (35,750)
- Shawnee city, OK (29,857)
- Ponca City city, OK (25,387)
- Yukon city, OK (22,709)
- Sapulpa city, OK (20,544)
Top 10 Neighboring Elementary School District (by Population) Neighboring Elementary School District on the Map
- Lone Star Public School, OK (4,213)
- Keystone Public School, OK (3,400)
- North Rock Creek Public School, OK (3,079)
- Allen-Bowden Public School, OK (2,758)
- Anderson Public School, OK (2,684)
- McCord Public School, OK (1,920)
- Pretty Water Public School, OK (1,791)
- Banner Public School, OK (1,685)
- Riverside Public School, OK (1,453)
- White Rock Public School, OK (1,445)
Top 10 Neighboring Unified School District (by Population) Neighboring Unified School District on the Map
- Tulsa Public Schools, OK (284,811)
- Edmond Public Schools, OK (132,523)
- Putnam City Public Schools, OK (119,728)
- Jenks Public Schools, OK (64,876)
- Stillwater Public Schools, OK (51,774)
- Mustang Public Schools, OK (46,023)
- Enid Public Schools, OK (44,870)
- Bartlesville Public Schools, OK (38,264)
- Yukon Public Schools, OK (36,938)
- Ponca City Public Schools, OK (29,349)
Top 10 Neighboring State Legislative District Lower Chamber (by Population) Neighboring State Legislative District Lower Chamber on the Map
- State House District 86, TX (154,914)
- State House District 87, TX (152,193)
- State House District 88, TX (141,962)
- State House District 68, TX (135,942)
- State House District 64, CO (63,179)
- State House District 39, OK (48,123)
- State House District 41, OK (46,325)
- State House District 43, OK (44,484)
- State House District 31, OK (44,222)
- State House District 69, OK (43,787)
Top 10 Neighboring State Legislative District Upper Chamber (by Population) Neighboring State Legislative District Upper Chamber on the Map
- State Senate District 30, TX (823,594)
- State Senate District 31, TX (727,115)
- State Senate District 28, TX (704,340)
- State Senate District 2, CO (125,412)
- State Senate District 22, OK (98,783)
- State Senate District 47, OK (89,219)
- State Senate District 34, OK (88,558)
- State Senate District 41, OK (88,446)
- State Senate District 37, OK (85,784)
- State Senate District 45, OK (85,350)
Top 10 Neighboring Census Tract (by Population) Neighboring Census Tract on the Map
- Census Tract 5010.01, Pottawatomie County, OK (8,391)
- Census Tract 6004, Logan County, OK (8,379)
- Census Tract 109, Payne County, OK (8,266)
- Census Tract 67.07, Tulsa County, OK (8,260)
- Census Tract 1082.13, Oklahoma County, OK (8,144)
- Census Tract 3008.01, Canadian County, OK (8,021)
- Census Tract 13, Garfield County, OK (7,838)
- Census Tract 9614, Lincoln County, OK (7,782)
- Census Tract 6008, Logan County, OK (7,704)
- Census Tract 9607, Custer County, OK (7,611)
Top 10 Neighboring 5-Digit ZIP Code Tabulation Area (by Population) Neighboring 5-Digit ZIP Code Tabulation Area on the Map
- 73099, OK (57,492)
- 73034, OK (39,872)
- 74066, OK (31,060)
- 74063, OK (29,808)
- 74074, OK (29,184)
- 73703, OK (27,951)
- 73162, OK (27,758)
- 73132, OK (26,432)
- 73012, OK (25,851)
- 73701, OK (24,808)
Data
Demographic, Population, Households, and Housing Units
** Data sources from census 2010 **
Show Data on Map
Download Full List as CSV
Download Quick Sheet as CSV
| Subject | This Area | Oklahoma | National |
|---|---|---|---|
| POPULATION | |||
| Total Population Map | 732,394 | 3,751,351 | 308,745,538 |
| POPULATION, HISPANIC OR LATINO ORIGIN | |||
| Not Hispanic or Latino Map | 670,468 | 3,419,344 | 258,267,944 |
| Hispanic or Latino Map | 61,926 | 332,007 | 50,477,594 |
| POPULATION, RACE | |||
| White alone Map | 588,946 | 2,706,845 | 223,553,265 |
| Black or African American alone Map | 26,896 | 277,644 | 38,929,319 |
| American Indian and Alaska Native alone Map | 48,029 | 321,687 | 2,932,248 |
| Asian alone Map | 7,371 | 65,076 | 14,674,252 |
| Native Hawaiian and Other Pacific Islander alone Map | 1,457 | 4,369 | 540,013 |
| Some Other Race alone Map | 26,169 | 154,409 | 19,107,368 |
| Two or More Races Map | 33,526 | 221,321 | 9,009,073 |
| POPULATION, SEX | |||
| Male Map | 368,941 | 1,856,977 | 151,781,326 |
| Female Map | 363,453 | 1,894,374 | 156,964,212 |
| POPULATION, AGE (18 YEARS) | |||
| 18 years and over Map | 554,532 | 2,821,685 | 234,564,071 |
| Under 18 years | 177,862 | 929,666 | 74,181,467 |
| POPULATION, AGE | |||
| Under 5 years | 50,027 | 264,126 | 20,201,362 |
| 5 to 9 years | 49,539 | 259,336 | 20,348,657 |
| 10 to 14 years | 48,728 | 253,664 | 20,677,194 |
| 15 to 17 years | 29,568 | 152,540 | 12,954,254 |
| 18 and 19 years | 23,570 | 111,944 | 9,086,089 |
| 20 years | 12,004 | 56,068 | 4,519,129 |
| 21 years | 11,742 | 54,032 | 4,354,294 |
| 22 to 24 years | 31,606 | 159,142 | 12,712,576 |
| 25 to 29 years | 48,837 | 265,737 | 21,101,849 |
| 30 to 34 years | 44,940 | 241,018 | 19,962,099 |
| 35 to 39 years | 42,966 | 232,742 | 20,179,642 |
| 40 to 44 years | 43,141 | 228,195 | 20,890,964 |
| 45 to 49 years | 51,611 | 261,242 | 22,708,591 |
| 50 to 54 years | 52,422 | 264,369 | 22,298,125 |
| 55 to 59 years | 47,029 | 235,969 | 19,664,805 |
| 60 and 61 years | 16,970 | 85,815 | 7,113,727 |
| 62 to 64 years | 23,035 | 118,698 | 9,704,197 |
| 65 and 66 years | 13,733 | 68,668 | 5,319,902 |
| 67 to 69 years | 18,483 | 90,724 | 7,115,361 |
| 70 to 74 years | 25,241 | 121,075 | 9,278,166 |
| 75 to 79 years | 19,565 | 95,051 | 7,317,795 |
| 80 to 84 years | 14,394 | 69,284 | 5,743,327 |
| 85 years and over | 13,243 | 61,912 | 5,493,433 |
| MEDIAN AGE BY SEX | |||
| Both sexes Map | 36.90 | 36.20 | 37.20 |
| Male Map | 35.50 | 34.90 | 35.80 |
| Female Map | 38.30 | 37.70 | 38.50 |
| HOUSEHOLDS | |||
| Total Households Map | 280,317 | 1,460,450 | 116,716,292 |
| HOUSEHOLDS, HOUSEHOLD TYPE | |||
| Family households: Map | 190,345 | 975,267 | 77,538,296 |
| Husband-wife family Map | 147,590 | 722,435 | 56,510,377 |
| Other family: Map | 42,755 | 252,832 | 21,027,919 |
| Male householder, no wife present Map | 13,601 | 73,524 | 5,777,570 |
| Female householder, no husband present Map | 29,154 | 179,308 | 15,250,349 |
| Nonfamily households: Map | 89,972 | 485,183 | 39,177,996 |
| Householder living alone Map | 74,422 | 401,153 | 31,204,909 |
| Householder not living alone Map | 15,550 | 84,030 | 7,973,087 |
| HOUSEHOLDS, HISPANIC OR LATINO ORIGIN OF HOUSEHOLDER | |||
| Not Hispanic or Latino householder: Map | 265,220 | 1,375,637 | 103,254,926 |
| Hispanic or Latino householder: Map | 15,097 | 84,813 | 13,461,366 |
| HOUSEHOLDS, RACE OF HOUSEHOLDER | |||
| Householder who is White alone | 238,520 | 1,126,295 | 89,754,352 |
| Householder who is Black or African American alone | 8,654 | 105,046 | 14,129,983 |
| Householder who is American Indian and Alaska Native alone | 14,696 | 104,630 | 939,707 |
| Householder who is Asian alone | 2,231 | 20,120 | 4,632,164 |
| Householder who is Native Hawaiian and Other Pacific Islander alone | 312 | 1,191 | 143,932 |
| Householder who is Some Other Race alone | 7,322 | 41,632 | 4,916,427 |
| Householder who is Two or More Races | 8,582 | 61,536 | 2,199,727 |
| HOUSEHOLDS, HOUSEHOLD TYPE BY HOUSEHOLD SIZE | |||
| Family households: Map | 190,345 | 975,267 | 77,538,296 |
| 2-person household Map | 87,986 | 434,417 | 31,882,616 |
| 3-person household Map | 41,010 | 219,620 | 17,765,829 |
| 4-person household Map | 33,948 | 178,628 | 15,214,075 |
| 5-person household Map | 17,069 | 87,900 | 7,411,997 |
| 6-person household Map | 6,422 | 34,017 | 3,026,278 |
| 7-or-more-person household Map | 3,910 | 20,685 | 2,237,501 |
| Nonfamily households: Map | 89,972 | 485,183 | 39,177,996 |
| 1-person household Map | 74,422 | 401,153 | 31,204,909 |
| 2-person household Map | 12,393 | 68,240 | 6,360,012 |
| 3-person household Map | 2,092 | 10,338 | 992,156 |
| 4-person household Map | 806 | 3,939 | 411,171 |
| 5-person household Map | 184 | 993 | 126,634 |
| 6-person household Map | 45 | 326 | 48,421 |
| 7-or-more-person household Map | 30 | 194 | 34,693 |
| HOUSING UNITS | |||
| Total Housing Units Map | 324,436 | 1,664,378 | 131,704,730 |
| HOUSING UNITS, OCCUPANCY STATUS | |||
| Occupied Map | 280,317 | 1,460,450 | 116,716,292 |
| Vacant Map | 44,119 | 203,928 | 14,988,438 |
| HOUSING UNITS, OCCUPIED, TENURE | |||
| Owned with a mortgage or a loan Map | 112,925 | 611,266 | 52,979,430 |
| Owned free and clear Map | 85,639 | 370,494 | 23,006,644 |
| Renter occupied Map | 81,753 | 478,690 | 40,730,218 |
| HOUSING UNITS, VACANT, VACANCY STATUS | |||
| For rent Map | 11,073 | 59,264 | 4,137,567 |
| Rented, not occupied Map | 578 | 2,717 | 206,825 |
| For sale only Map | 4,490 | 22,671 | 1,896,796 |
| Sold, not occupied Map | 2,346 | 8,405 | 421,032 |
| For seasonal, recreational, or occasional use Map | 6,052 | 35,187 | 4,649,298 |
| For migrant workers Map | 117 | 318 | 24,161 |
| Other vacant Map | 19,463 | 75,366 | 3,652,759 |
| HOUSING UNITS, OCCUPIED, AVERAGE HOUSEHOLD SIZE BY TENURE | |||
| Total: Map | 2.49 | 2.49 | 2.58 |
| Owner occupied Map | 2.54 | 2.54 | 2.65 |
| Renter occupied Map | 2.39 | 2.38 | 2.44 |
| HOUSING UNITS, OCCUPIED, TENURE BY RACE OF HOUSEHOLDER | |||
| Owner occupied: Map | 198,564 | 981,760 | 75,986,074 |
| Householder who is White alone Map | 174,536 | 802,001 | 63,446,275 |
| Householder who is Black or African American alone Map | 4,227 | 43,781 | 6,261,464 |
| Householder who is American Indian and Alaska Native alone Map | 9,335 | 67,547 | 509,588 |
| Householder who is Asian alone Map | 1,030 | 11,960 | 2,688,861 |
| Householder who is Native Hawaiian and Other Pacific Islander alone Map | 72 | 446 | 61,911 |
| Householder who is Some Other Race alone Map | 4,091 | 19,101 | 1,975,817 |
| Householder who is Two or More Races Map | 5,273 | 36,924 | 1,042,158 |
| Renter occupied: Map | 81,753 | 478,690 | 40,730,218 |
| Householder who is White alone Map | 63,984 | 324,294 | 26,308,077 |
| Householder who is Black or African American alone Map | 4,427 | 61,265 | 7,868,519 |
| Householder who is American Indian and Alaska Native alone Map | 5,361 | 37,083 | 430,119 |
| Householder who is Asian alone Map | 1,201 | 8,160 | 1,943,303 |
| Householder who is Native Hawaiian and Other Pacific Islander alone Map | 240 | 745 | 82,021 |
| Householder who is Some Other Race alone Map | 3,231 | 22,531 | 2,940,610 |
| Householder who is Two or More Races Map | 3,309 | 24,612 | 1,157,569 |
| HOUSING UNITS, OCCUPIED, TENURE BY HISPANIC OR LATINO ORIGIN OF HOUSEHOLDER | |||
| Owner occupied: Map | 198,564 | 981,760 | 75,986,074 |
| Not Hispanic or Latino householder Map | 190,108 | 940,332 | 69,617,625 |
| Hispanic or Latino householder Map | 8,456 | 41,428 | 6,368,449 |
| Renter occupied: Map | 81,753 | 478,690 | 40,730,218 |
| Not Hispanic or Latino householder Map | 75,112 | 435,305 | 33,637,301 |
| Hispanic or Latino householder Map | 6,641 | 43,385 | 7,092,917 |
| HOUSING UNITS, OCCUPIED, TENURE BY HOUSEHOLD SIZE | |||
| Owner occupied: Map | 198,564 | 981,760 | 75,986,074 |
| 1-person household Map | 44,592 | 222,740 | 16,453,569 |
| 2-person household Map | 78,902 | 379,461 | 27,618,605 |
| 3-person household Map | 30,430 | 156,161 | 12,517,563 |
| 4-person household Map | 25,317 | 127,864 | 10,998,793 |
| 5-person household Map | 12,110 | 59,965 | 5,057,765 |
| 6-person household Map | 4,563 | 22,494 | 1,965,796 |
| 7-or-more-person household Map | 2,650 | 13,075 | 1,373,983 |
| Renter occupied: Map | 81,753 | 478,690 | 40,730,218 |
| 1-person household Map | 29,830 | 178,413 | 14,751,340 |
| 2-person household Map | 21,477 | 123,196 | 10,624,023 |
| 3-person household Map | 12,672 | 73,797 | 6,240,422 |
| 4-person household Map | 9,437 | 54,703 | 4,626,453 |
| 5-person household Map | 5,143 | 28,928 | 2,480,866 |
| 6-person household Map | 1,904 | 11,849 | 1,108,903 |
| 7-or-more-person household Map | 1,290 | 7,804 | 898,211 |
Loading...